Create a report
When building a report, you may want to Start with data and then select the chart type.
Alternatively, you may want to Start with a chart type and then select the data.
Either way, you will need to enter into the Edit mode and access Visualizer.
- On the navigation bar, click Self Service.
- Click
 .
. - Click
Insert
 >
New Report.
 Remember, anytime you need to start over, you can click Create a New Chart.

Learn how to:
Start with data
When creating a report that starts
with data, the best practice is to start
with a measure ![]() .
.
You can locate a measure in a couple of ways:
- Enter
the name in search: Visualizer searches all the measures, attributes,
and folders in the subject area of the space.
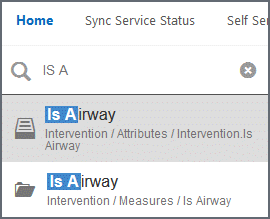
Or
- In Subject Areas: Click a subject
to browse a list of measures.
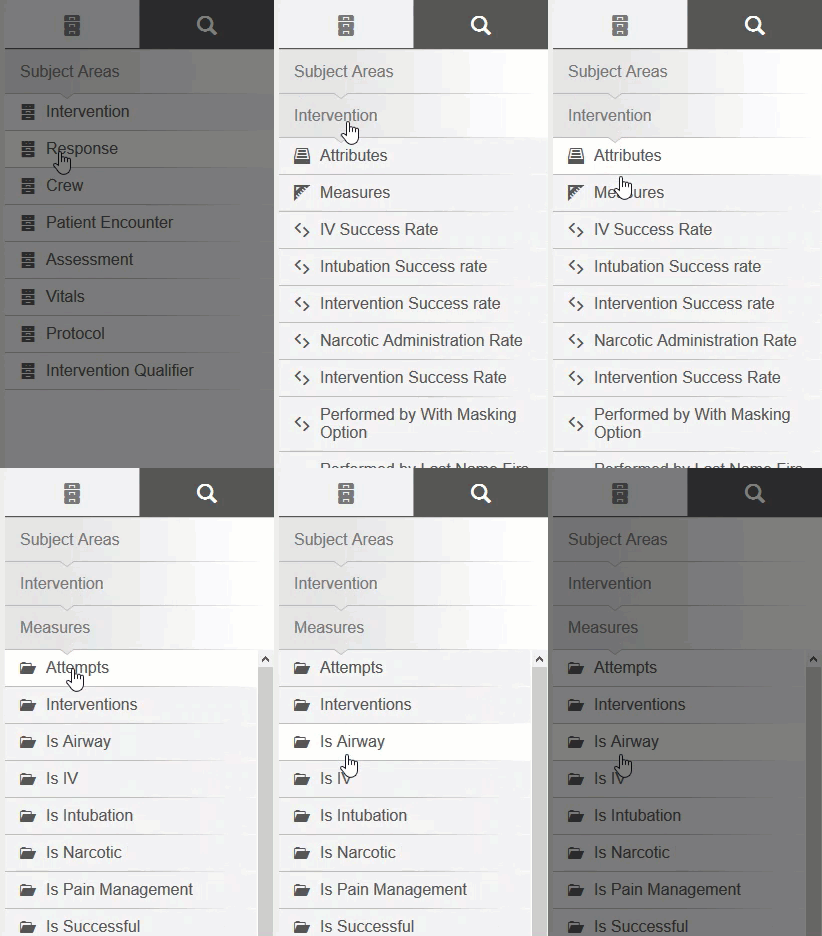
Tip: When the name of the attribute or measure includes an underscore (_) or period (.), those characters are omitted from the name in the Subject Area and other parts of the interface.
After you locate a measure, select it by either:
- Clicking
the name of the measure
or
- Dragging and dropping it onto the Canvas.
Visualizer adds the column to the appropriate tab in Chart Builder and builds a visualization on the Canvas. By default, it creates a column chart as indicated by the column icon on the tab next to the measure.
To see important details about the measure, hover over it in Chart Builder.
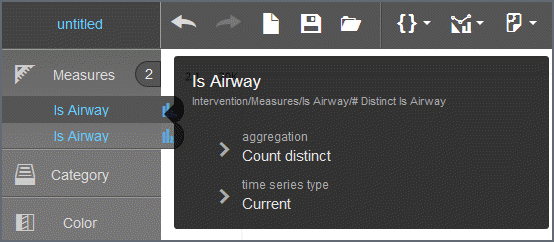
Grabbed the wrong measure or attribute by mistake? Delete it by pointing your mouse on the item on Chart Builder, hold down the clicker until the delete bucket displays, and then drag and drop the measure into the bucket like this:
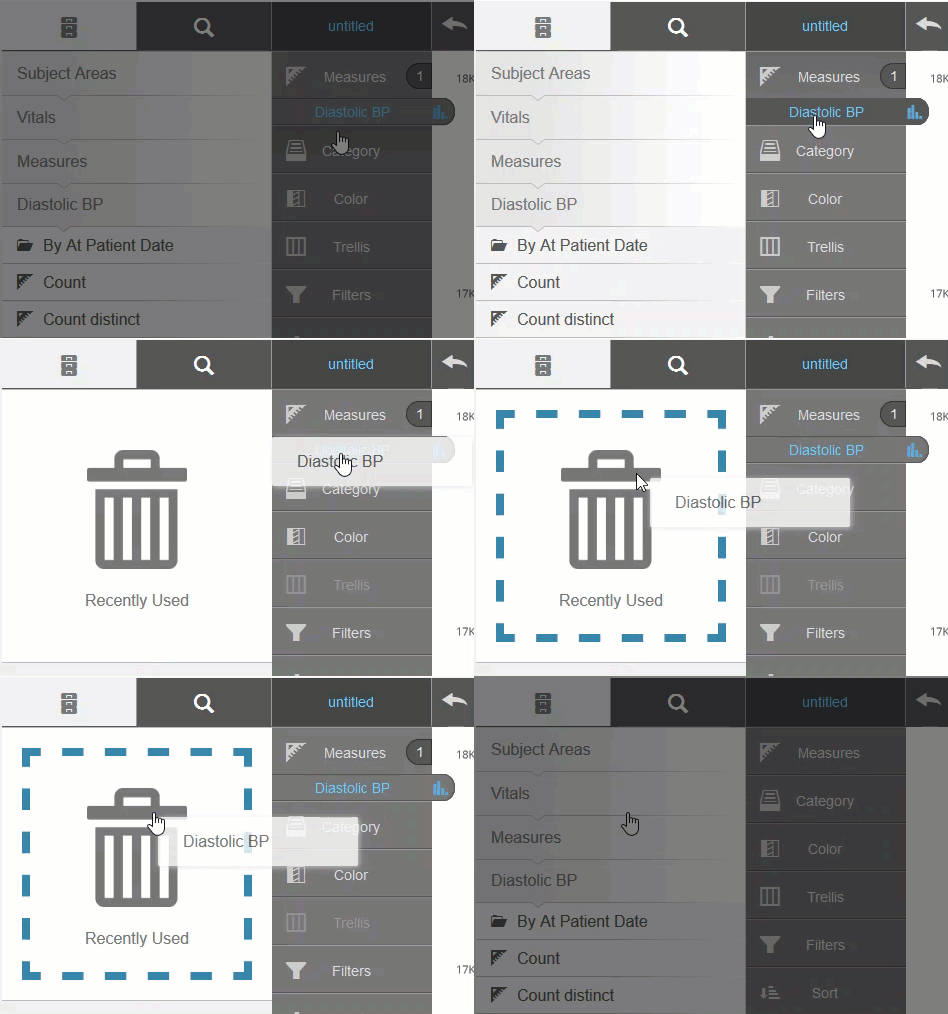
Important! Chart Builder can disappear in a web browser (Chrome, Firefox etc.) if you change the browser font size from medium (recommended) to large or extra-large. If you revert the font size back to medium, the staging menu will be restored.
To change the properties of a measure, in Chart Builder click the measure and select from the list of options.
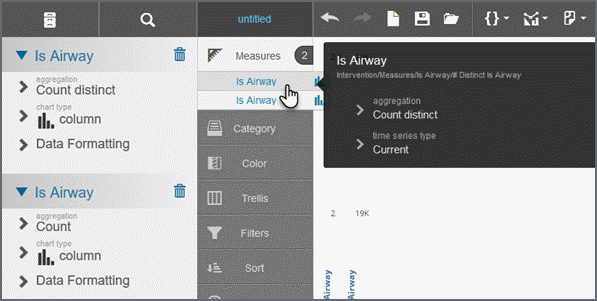
You can change:
- Aggregation: Count distinct, count, average, maximum, minimum, or sum.
- Date type: By order_date, ship_date, or other date types that exist in the underlying data model.
- Time series type: Current, trailing 12 months
(TTM), trailing three months, month ago (MAGO), quarter ago (QAGO), year
ago (YAGO), quarter to-date (QTD), year-to-date (YTD).
Note: If you change the time series type, you also need to add a time attribute such as Time.Month, Time.Quarter, and Time.Year.
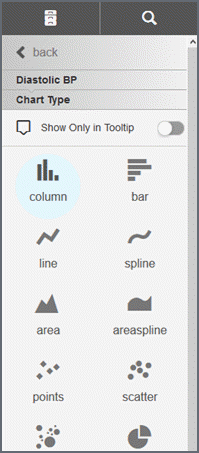
- Chart types: Shows the current chart
type and lets you change to another type of chart.
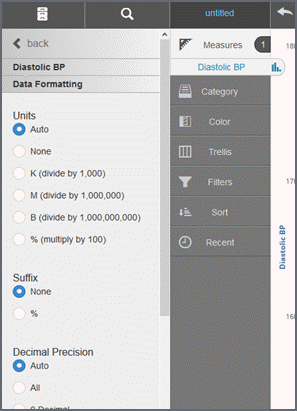
- Data formatting: Change the units, suffix, decimal precision, and currency.
- Calculations: This option appears after you add an attribute along with the measure.
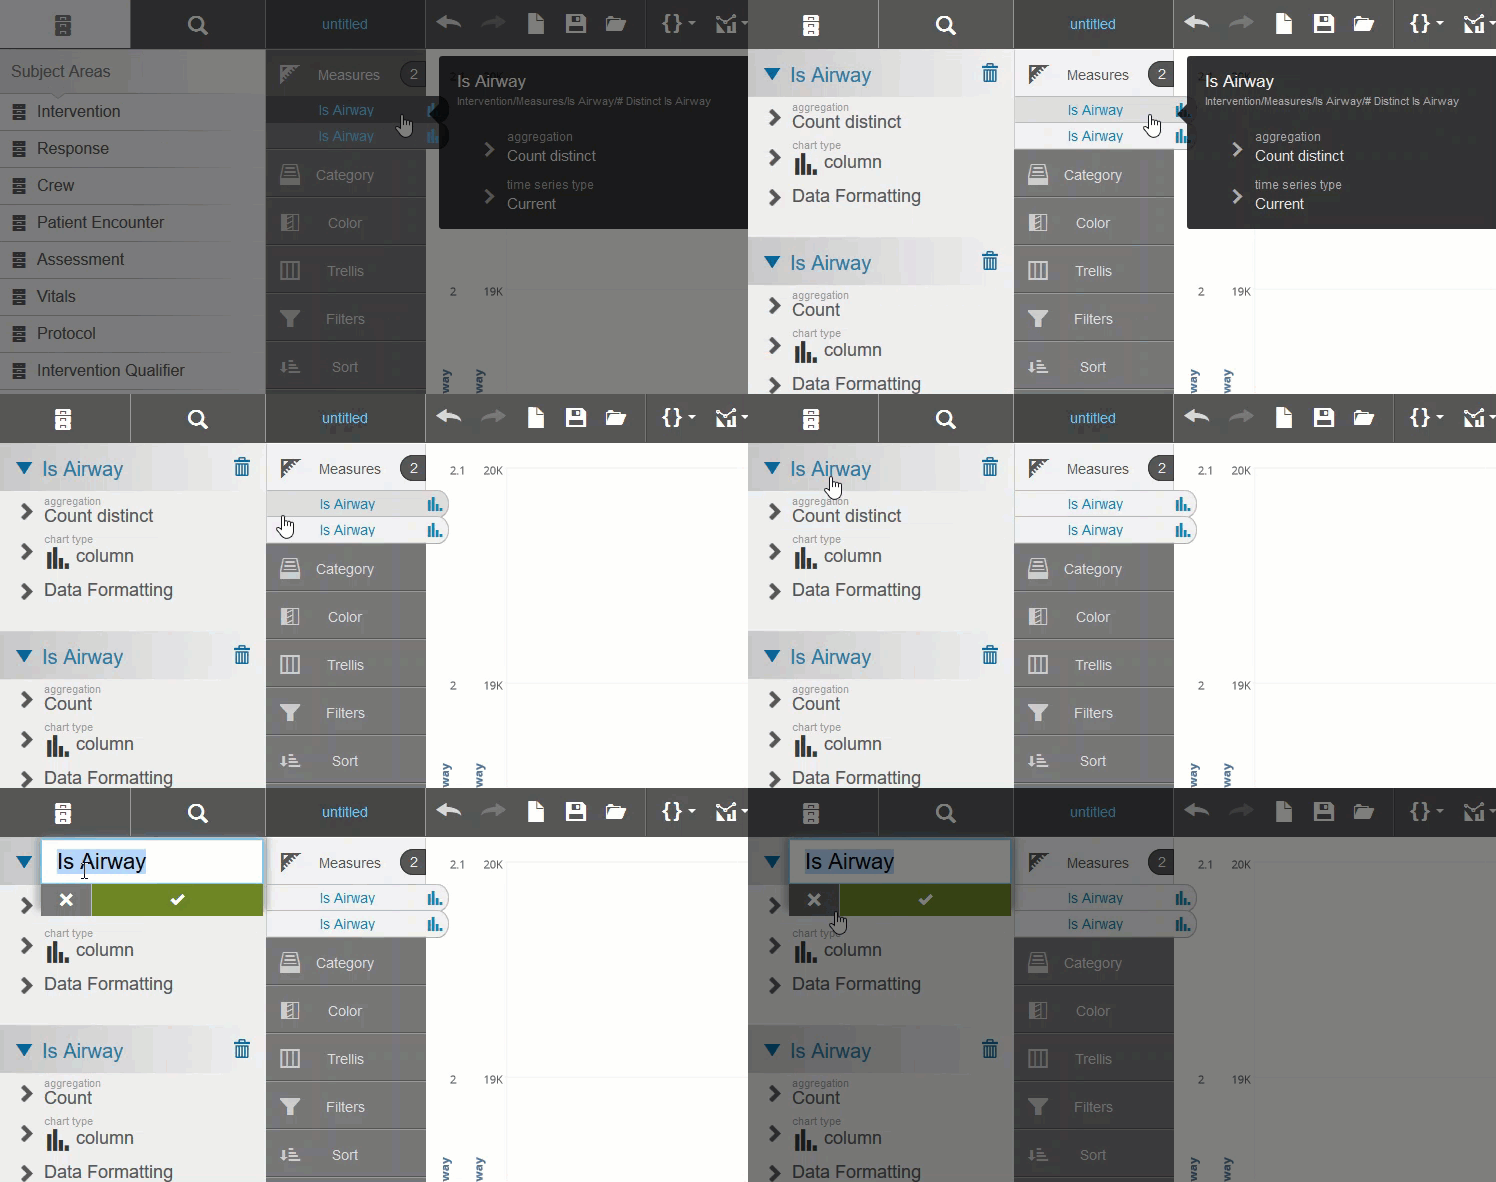
To change the label of an attribute or measure, double-click its name in Chart Builder to show its properties list. Then double-click the property name to open the edit box, type the new name, and click Apply.
- Click Subject Area
 to go back and find the attributes
  .
. - Add an attribute. Chart Builder adds the attribute to the category and plots a bar chart.
- Click Save.
- Pick the folder and then name
the report.

- Click Save.
Start with a chart type
If you know the type of chart you want to create, start creating your report by selecting a chart type.
In Visualizer, click Change Visualization.
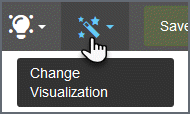
Select the visualization type you want to use.
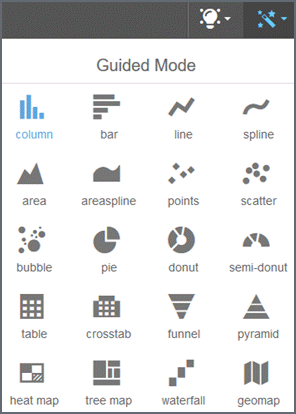
Visualizer indicates the attributes and measures needed to create a report of that type. Many charts need only one measure and attribute. Others, such as bubble charts, need more data to create a highly usable visualization.
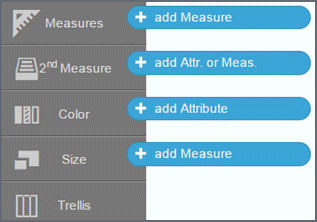
Add measures and attributes as described in Start with data.
When you are done, Save the report.
Undo and redo
Use the undo/redo arrows on the menu bar for most operations in Visualizer.

Cntrl -Z/Cntrl-Shift-Z or Command-Z/Command-Shift-Z also works.
You can undo/redo up to the last 20 actions. The undo/redo history resets when you perform a save or save as.
Undo/redo applies to most report-building activities including chart formatting.
Tip: In the Chart Formatting pane, use the keyboard commands.
The following operations cannot be undone/redone:
- Toggling Delay Charting mode
- Uploading custom maps
- Saved expressions
- Saving and renaming files
- Editing Column Selectors
- Color palette creation
- Advanced conditional formatting
- Clicking a legend to hide columns
- Creating and saving expressions in the Expression Editor
- End User Data Blending
Result set limit
When creating a report, Visualizer limits the number of rows in a query result to 100 by default. This value displays on the toolbar.

If the total number of data points exceed 100, a message displays telling you that only the top 100 data points are displayed. If you want to increase this limit, do the following:
- Click the Top N Results
button.

- Click the custom button.
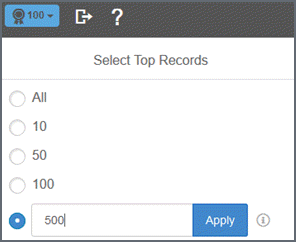
- Enter the new value.
- Click Apply.
Important! Before saving a report, check the that the 'Top N' value is what is needed by your company. For example, 'All' may return too many rows and affect performance while '100' may not be enough.
Save the report
Save the report without inserting
If you are not finished with the report but you need to quit, save the report so you can pick it up later.
- Click Save.
- Pick either
a private or shared folder.

Tips:
- Reports in the private folder will not be accessible to others. To allow others to access the report when sharing a space, save the report in the shared folder.
- The report name must be unique within a folder.
- A Visualizer report cannot be moved to a different folder from within the Visualizer module. You can create, rename or delete folders.
- Type the name of the report in the Report Name field.
- Click Save. Visualizer saves the report
with a .viz.dashlet
filename extension.
The Visualizer page opens again for further editing.
Save and insert the report
Ready to use this report? Click Save & Insert.
![]()
Open a report
Click ![]() on the toolbar.
on the toolbar.
Tip: Use the search box to find a report by name.
Your private folder and the shared folder display. Select a folder to see the contents, then click a report name to open it in Visualizer.
Copy a report
- Open the report you want to copy.
- Click
 .
. - Type the name of the new report.
- Click Save As.
Export a report
- Open the report.
- Click Export and select an export format.
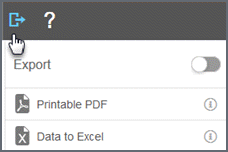
A confirmation message displays at the top right.
Important! To export a report, the user must belong to a user group that has downloads enabled.
Rename or delete a report
Click ![]() .
.
Tip: Use the search box to find a report by name.
Your private folder and the shared folder display. Select the folder that contains the report.
On the same line as the report:
- Delete: Click the trash can.
- Rename: Click the edit icon to change the report name and then click Save.